.
Medical background

Connective tissue diseases are autoimmune disorders caused by antinuclear autoantibodies (ANAs) and characterized by a chronic inflammatory process involving different organs. ANAs are directed against a variety of nuclear antigens and they can be detected in the serum of patients using laboratory tests. The recommended method for ANA testing is via the indirect immunofluorescence (IIF) protocol. The IIF makes use of different substrates, each one specific for the detection of certain antigens. The substrates bond with serum antibodies and form a molecular complex. Then, this complex reacts with human immunoglobulin conjugated with a fluorochrome. At the end of such reaction, the complex becomes observable at the fluorescence microscope revealing the antigen antibody reaction. In case of ANA tests, the most notable used substrate is the human larynx carcinoma (HEp-2) cells.
During the reading phase at the microscope, physicians detect and score the antigen antibody reaction according to a procedure organized in three steps: mitotic cells detection, fluorescence intensity classification and staining pattern recognition. The final goal is the recognition of the staining pattern of the cells in the specimen image, because depending on the patient clinical history, each pattern can be related to a specific disease.
An example of IIF image is shown in Figure 1. The picture shows the mitotic cells (highlighted with gray circles), some artifacts due to the acquisition procedure (white circles) and the normal cells (the remaining objects), revealing some patterns of fluorescent staining that are relevant for diagnostic purposes. All the steps of the diagnostic procedure can be formulated as pattern recognition problems , as it is briefly described below.
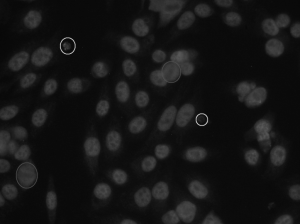
Figure 1. An IIF image
![]()
Step1: mitotic cell detection
The aim of this step is to verify the presence of at least a cell in the mitosis stage within the image under analysis. This step is important in IIF for two reasons. The presence of at least one fluorescent mitotic cell ensures medical doctors about the correctness of the preparation procedure. In addition, there are a number of antibodies that are either less concentrated or undetectable under interphase cells. Therefore, it is important to incorporate the pattern information of the mitotic cells when making decisions. Mitotic cells can exhibit in a number of fluorescence patterns. Among these, there are two typical patterns. The first, named as negative mitosis, is characterized by a fluorescent cell body, while the collapsed chromosomes mass located in the middle part of the cell does not exhibit a fluorescent pattern, or it has a weak fluorescence (left side of Figure 2). In the second pattern, referred to as positive mitosis, we observe the opposite situation, i.e. the cell body is weakly or not fluorescent, while the chromosomes mass is fluorescent (right side of Figure 2).
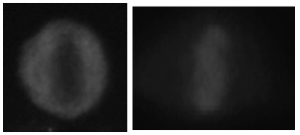
Figure 2. Example of mitotic cells: a negative mitosis (left) and a positive mitosis (right).
Step 2: fluorescence intensity classification
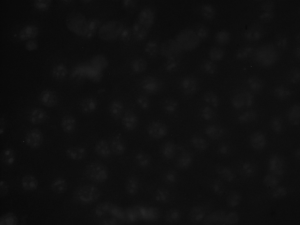
After the detection of mitotic cells, medical doctors classify the fluorescence intensity of the sample under observation into three broad classes, namely negative, intermediate (or borderline) and positive. Information about fluorescence intensity is important since staining pattern recognition, i.e. the last step of IIF diagnostic procedure, is performed only for positive or intermediate samples. In Figure 3, two IIF images are: on the left is shown an intermediate sample, while on the right is shown a positive one.
 |
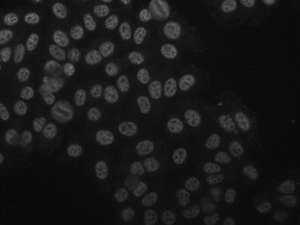 |
Figure 3. An intermediate (left) IIF image and a positive (right) one.
![]()
Step 3: staining pattern recognition
Positive and intermediate HEp-2 samples may reveal different patterns of fluorescent staining that are relevant for diagnostic purposes. In fact, more than thirty different nuclear and cytoplasmic patterns could be identified that are indicators of the presence of a number of autoimmune diseases. Examples of some relevant staining patterns of HEp-2 cells are shown in Figure 4, while a description is reported in the following:
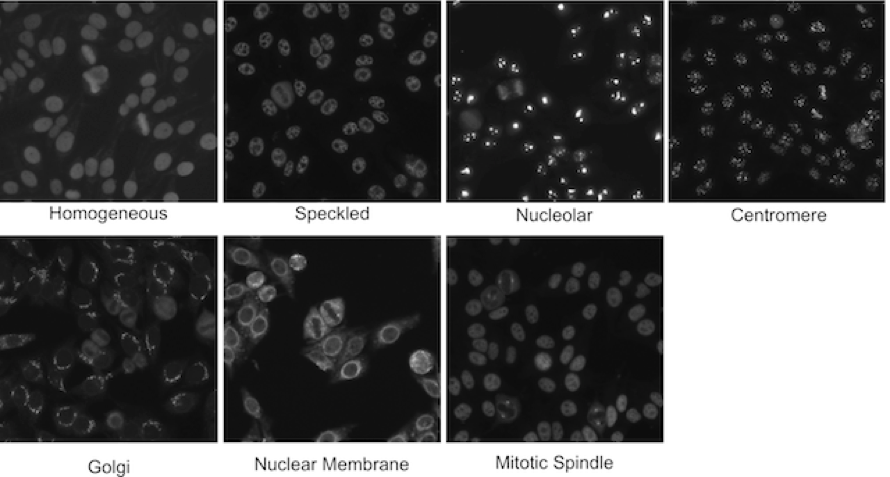
Figure 4.Relevant staining patterns of HEp-2 cells: the first four classes represent common ANA patterns whilst the other three classes are less common.
- homogeneous: [Common pattern] a uniform diffuse fluorescence covering the entire nucleoplasm sometimes accentuated in the nuclear periphery
- speckled: [Common pattern] these patterns have two sub-categories:
- coarse speckled: densely distributed, variously sized speckles, generally associated with larger speckles, throughout nucleoplasm of interphase cells; nucleoli are negative
- fine speckled: fine speckled staining in a uniform distribution, sometimes very dense so that an almost homogeneous pattern is attained; nucleoli may be positive or negative
- nucleolar: [Common pattern] brightly clustered large granules corresponding to decoration of the fibrillar centers of the nucleoli as well as the coiled bodies
- centromere: [Common pattern] rather uniform discrete speckles located throughout the entire nucleus
- Golgi: [Rare pattern] staining of a polar organelle adjacent to and paratly surrounding the nucleus, composed of irregular large granules. Nuclei and nucleoli are negative. Diffuse staining of the cytoplasm of dividing cells sometimes with accentuation around chromosomal material
- nuclear membrane: [Rare pattern] a smooth homogeneous ring-like fluorescence of the nuclear membrane in interphase cells
- mitotic spindle: [Rare pattern] staining only of the triangular or “banana-shaped” pole area of the mitotic spindle in the metaphase cells


